
Page 48 - FDMAsia May/Jun 2026
P. 48
46 MATERIALS MAY/JUN 2026 FDM ASIA | www.fdmasia.com
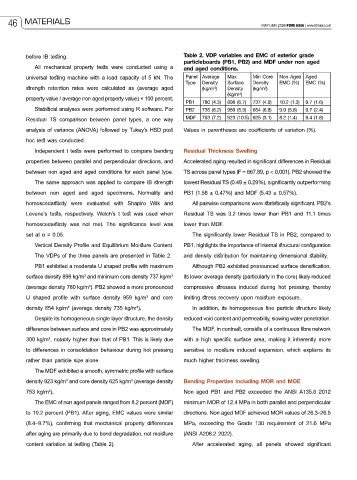
before IB testing. Table 2. VDP variables and EMC of exterior grade
particleboards (PB1, PB2) and MDF under non aged
All mechanical property tests were conducted using a and aged conditions.
universal testing machine with a load capacity of 5 kN. The Panel Average Max Min Core Non Aged Aged
Type Density Surface Density EMC (%) EMC (%)
strength retention rates were calculated as (average aged (kg/m³) Density (kg/m³)
(kg/m³)
property value / average non aged property value) × 100 percent.
PB1 780 (4.3) 898 (6.7) 737 (4.9) 10.2 (1.3) 9.7 (1.6)
Statistical analyses were performed using R software. For PB2 735 (6.2) 959 (5.3) 654 (6.8) 9.9 (5.8) 9.7 (2.4)
Residual TS comparison between panel types, a one way MDF 753 (7.2) 923 (10.5) 625 (3.1) 8.2 (1.4) 8.4 (1.8)
analysis of variance (ANOVA) followed by Tukey’s HSD post Values in parentheses are coefficients of variation (%).
hoc test was conducted.
Independent t tests were performed to compare bending Residual Thickness Swelling
properties between parallel and perpendicular directions, and Accelerated aging resulted in significant differences in Residual
between non aged and aged conditions for each panel type. TS across panel types (F = 667.89, p < 0.001). PB2 showed the
The same approach was applied to compare IB strength lowest Residual TS (0.49 ± 0.29%), significantly outperforming
between non aged and aged specimens. Normality and PB1 (1.58 ± 0.47%) and MDF (5.43 ± 0.57%).
homoscedasticity were evaluated with Shapiro Wilk and All pairwise comparisons were statistically significant. PB2’s
Levene’s tests, respectively. Welch’s t test was used when Residual TS was 3.2 times lower than PB1 and 11.1 times
homoscedasticity was not met. The significance level was lower than MDF.
set at α = 0.05. The significantly lower Residual TS in PB2, compared to
Vertical Density Profile and Equilibrium Moisture Content PB1, highlights the importance of internal structural configuration
The VDPs of the three panels are presented in Table 2. and density distribution for maintaining dimensional stability.
PB1 exhibited a moderate U shaped profile with maximum Although PB2 exhibited pronounced surface densification,
surface density 898 kg/m³ and minimum core density 737 kg/m³ its lower average density (particularly in the core) likely reduced
(average density 780 kg/m³). PB2 showed a more pronounced compressive stresses induced during hot pressing, thereby
U shaped profile with surface density 959 kg/m³ and core limiting stress recovery upon moisture exposure.
density 654 kg/m³ (average density 735 kg/m³). In addition, its homogeneous fine particle structure likely
Despite its homogeneous single layer structure, the density reduced void content and permeability, slowing water penetration.
difference between surface and core in PB2 was approximately The MDF, in contrast, consists of a continuous fibre network
300 kg/m³, notably higher than that of PB1. This is likely due with a high specific surface area, making it inherently more
to differences in consolidation behaviour during hot pressing sensitive to moisture induced expansion, which explains its
rather than particle size alone. much higher thickness swelling.
The MDF exhibited a smooth, symmetric profile with surface
density 923 kg/m³ and core density 625 kg/m³ (average density Bending Properties Including MOR and MOE
753 kg/m³). Non aged PB1 and PB2 exceeded the ANSI A135.6 2012
The EMC of non aged panels ranged from 8.2 percent (MDF) minimum MOR of 12.4 MPa in both parallel and perpendicular
to 10.2 percent (PB1). After aging, EMC values were similar directions. Non aged MDF achieved MOR values of 26.3–26.5
(8.4–9.7%), confirming that mechanical property differences MPa, exceeding the Grade 130 requirement of 21.6 MPa
after aging are primarily due to bond degradation, not moisture (ANSI A208.2 2022).
content variation at testing (Table 2). After accelerated aging, all panels showed significant